
Teilen:

We’re thrilled to unveil Solar Analytics 2.0 – a powerful leap forward in understanding and visualizing solar energy potential. Whether you're optimizing solar panel placement, evaluating daylight access in urban planning, or making informed real estate decisions based on solar exposure, this updated tool delivers unmatched flexibility and clarity.
🔍 What Is 3D Solar Analytics?
At its core, 3D Solar Analytics is the easiest and most comprehensive way to understand solar potential on any surface visible in Shadowmap. Not just rooftops or horizontal planes – we’re talking any surface: vertical façades, sloped walls, complex geometries.
What makes our analysis truly 3D is the depth of our modeling:
It respects all visible 3D objects in a 50 km radius – buildings, trees, terrain, even custom high-res 3D models.
It factors in both direct and diffuse sunlight, using real sun irradiance and weather data recorded over the last 20 years.
It’s fully WYSIWYG (what you see is what you get): You can use our worldwide available building data and add custom geometry (cylinders, cubes, roof shapes or vegetation) or switch to Google 3D buildings mode on the fly (photorealistic environments in available regions and cities). It's even possible to upload your own 3D models.
This is next-gen 3D solar analysis built for architects, urban planners, landscape designers, and real estate developers who demand precision and visual clarity.
🌞 What’s New in Solar Analytics 2.0?
We've made major upgrades that make solar exposure analysis more powerful, accessible, and versatile than ever. Georg will give you a tour in this Youtube Video:
Youtube Video: Shadowmap Founder Georg Molzer shows the new capabilities of Solar Analytics 2.0
🗺️ Use Solar Analytics Anywhere on the Map
Solar Analytics is no longer limited to specific projects. Now you can analyze any location globally – instantly. Just click and measure.
Whether you're studying a balcony in Berlin or a skyscraper in São Paulo, real estate sun studies and sunlight analysis for buildings are now as simple as zoom and click.
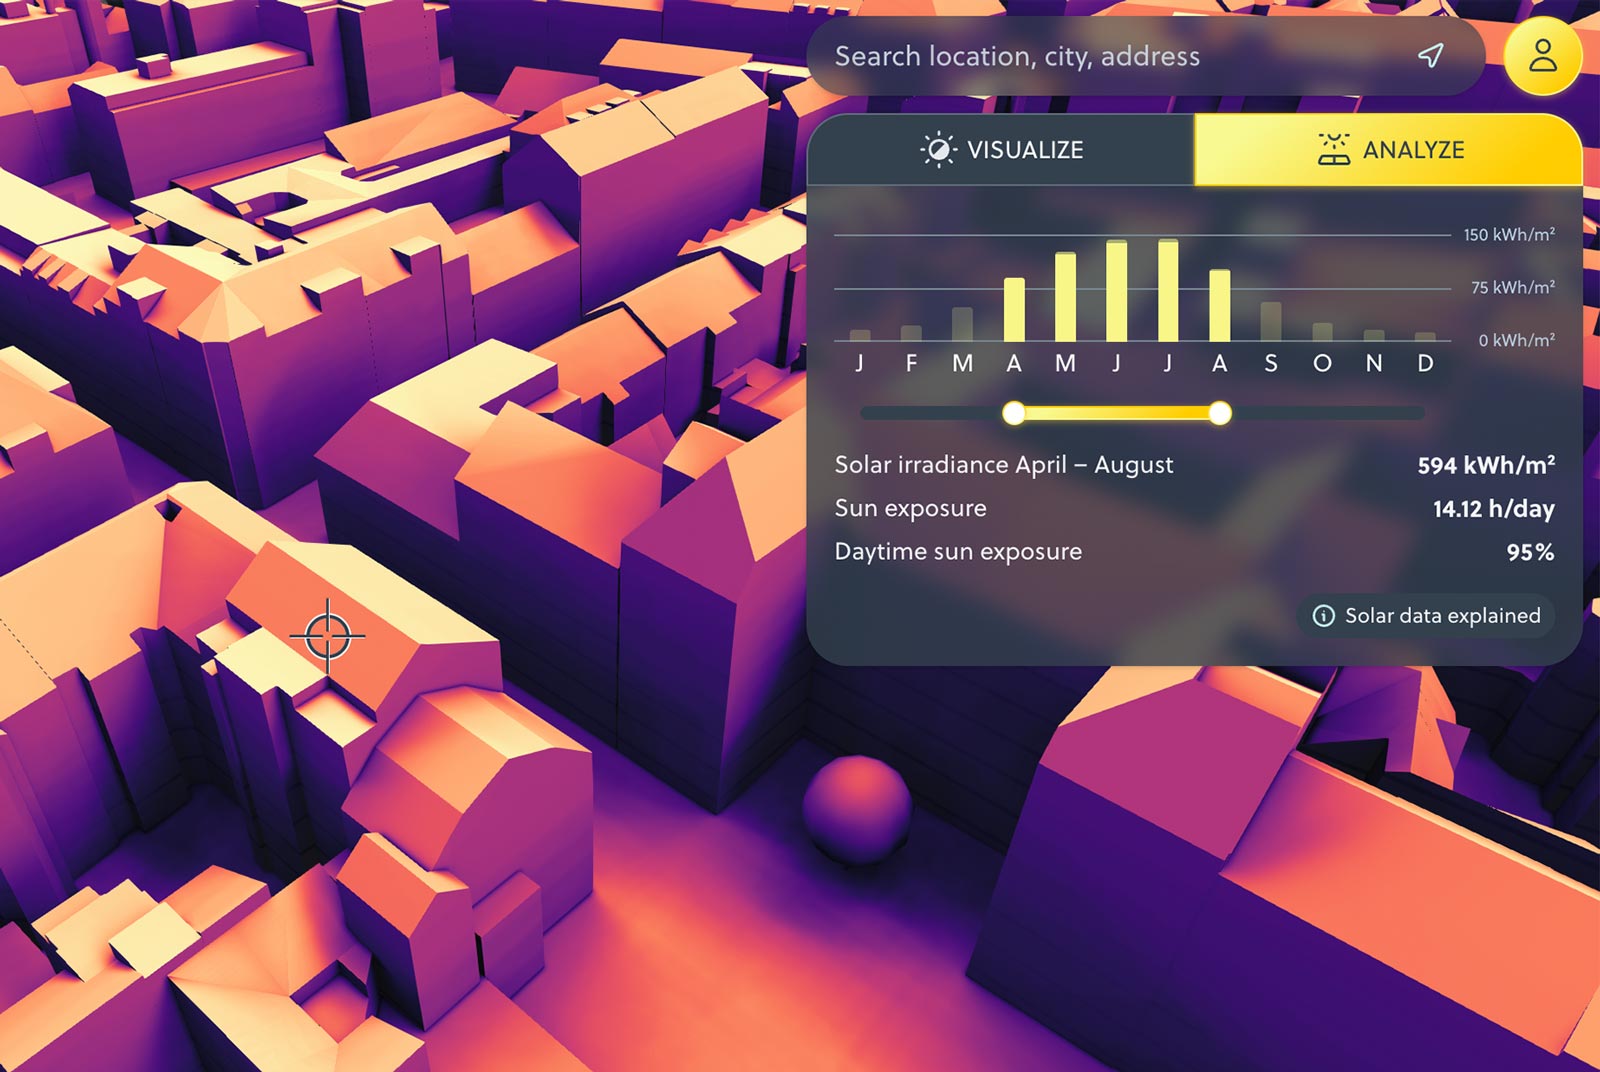
📊 Monthly Solar Charts – Now with Time Range Control
One of our most requested features is here: monthly analysis.
Use the Time Range Slider to drill down into seasonal sunlight trends. Understand how solar exposure changes month by month, which is vital for:
Passive solar design
Seasonal energy performance
Window placement optimization
Landscape planning
Finding the best home orientation for natural light
Compare sunny winter mornings vs. shaded summer afternoons at a glance.
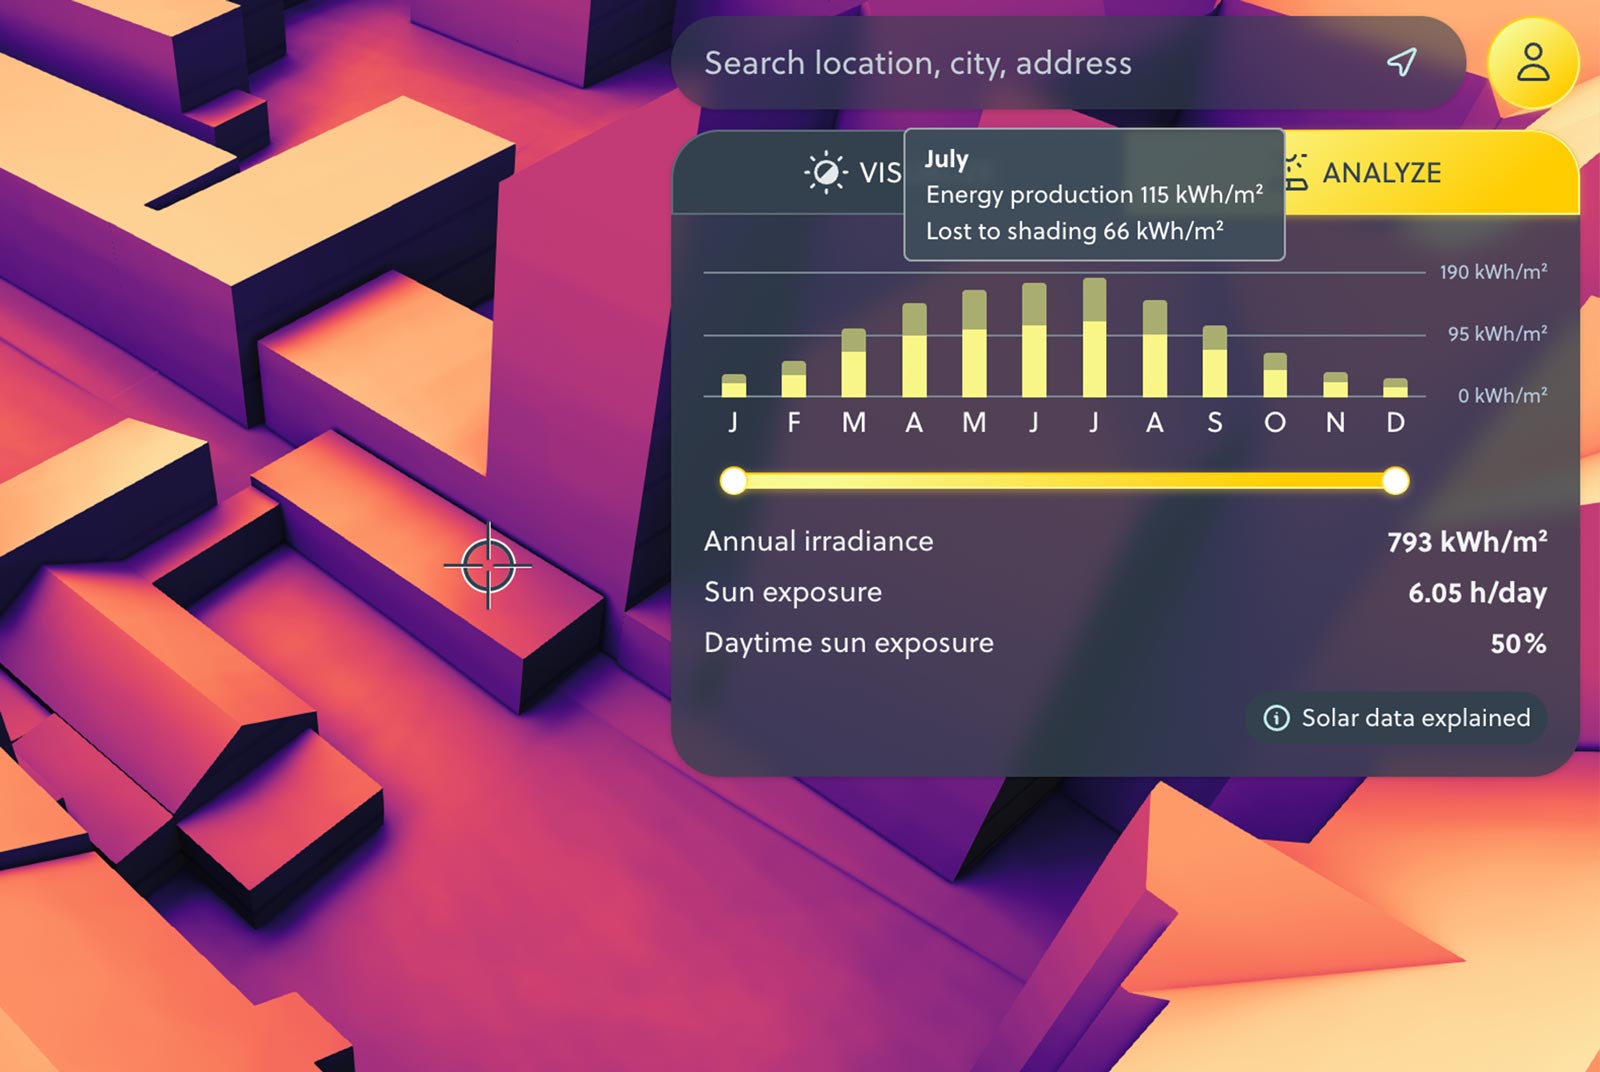
🏙️ Monthly Shading Loss Visualized
Our new shading loss visualization shows how much solar potential is lost each month due to shadows. These losses are now included directly in your monthly bar charts, helping you:
Pinpoint problematic shadows from nearby buildings or trees
Improve PV system efficiency with better panel positioning
Understand seasonal daylight access for residential and commercial design
📐 Key Metrics Explained
We calculate a rich set of solar irradiance and exposure metrics, with everything based on high-quality data and precision modeling:
Annual Irradiance (kWh/m²): Yearly solar energy received per square meter, including 3D shadows and atmospheric effects.
Sun Exposure (h/day): Average direct sunlight hours per day, excluding weather impacts.
Daytime Sun Exposure (%): The proportion of daylight hours a surface receives direct sun, fully accounting for surrounding 3D shading.
🔧 How We Calculate Solar Potential
Our engine simulates both direct sunlight and diffuse illumination using:
A detailed 3D model of all visible structures and terrain
Real-world solar irradiance records from the past 20 years
Distinction between atmospheric diffusion and direct sunlight
50 km radius for shadows and terrain consideration
This makes Solar Analytics 2.0 one of the most accurate tools available for solar exposure simulation, ideal for:
Urban planning
Architectural design
Sustainable development
Solar feasibility assessments
☀️ Why Shadowmap Solar Analytics Matters
Solar Analytics 2.0 empowers professionals to make smarter, sun-informed decisions with every click. From maximizing rooftop solar installations to designing light-filled homes and reducing shading risks in dense urban environments, this tool unlocks solar intelligence for the 3D world we live in.
Whether you're planning the next green city block or just want to know if your window gets enough winter sun, Solar Analytics 2.0 delivers clarity, precision, and solar insight – instantly.
Disclaimer: While our solar modeling uses best-in-class methods and data, environmental complexity means absolute accuracy can’t be guaranteed. Make sure to compare what you see in Shadowmap with the real world location.
Diesen Artikel teilen:

MEHR ERFAHREN
Erhellende Einblicke


BEKANNT AUS


