Share:

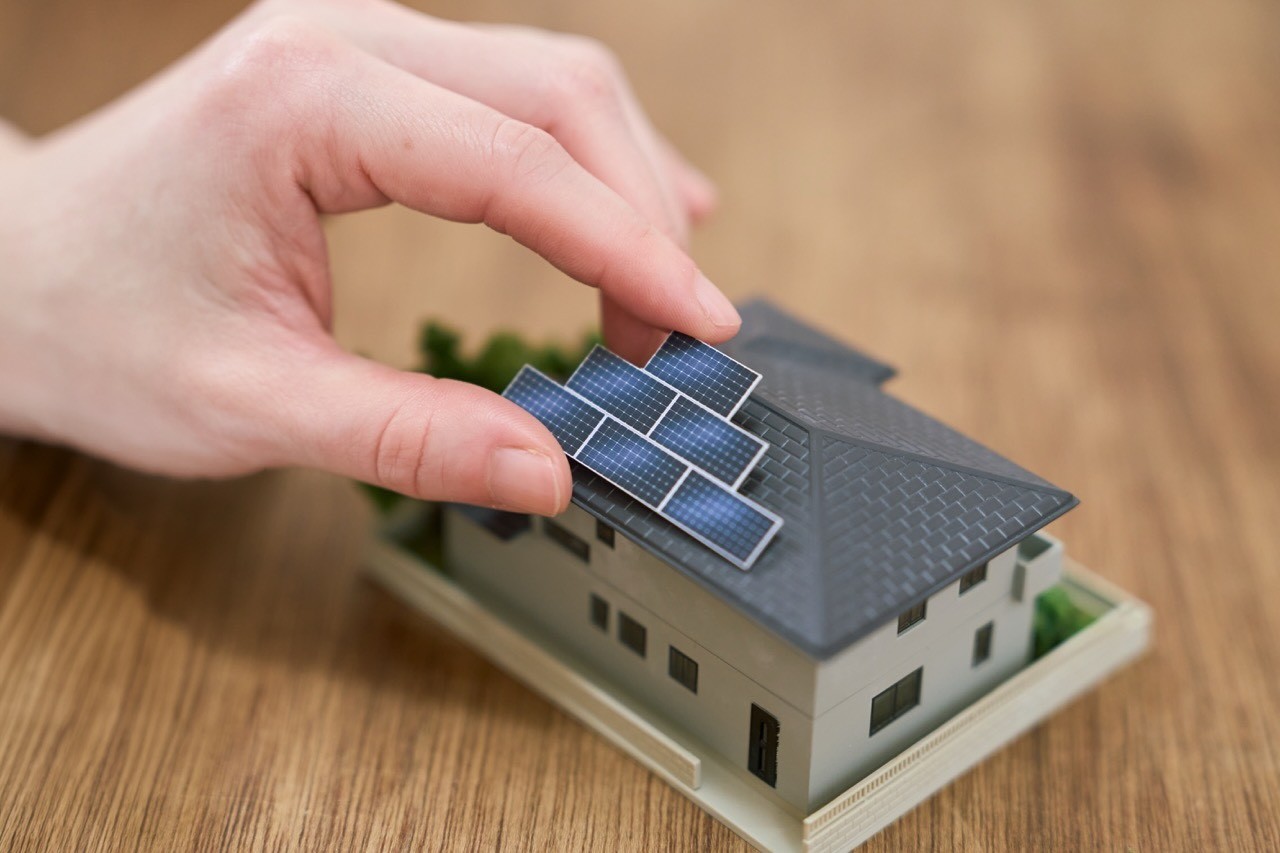
Residential solar adoption is accelerating. In 2024, the global solar market crossed 1.6 TW of cumulative installed capacity, and homeowners now account for a growing share of new installations — driven by falling panel costs, rising electricity prices, and expanding government incentive programs across the US, Europe, and beyond.
But how do you decide if your house is good for solar energy?
Making the decision to go solar is not straightforward. Beyond the upfront installation cost — which typically runs between $15,000 and $30,000 in the US and €8,000 to €25,000 in Europe. The financial case depends heavily on local variables: your utility's net metering policy, available feed-in tariffs, tax credits, and crucially, how much usable sunlight your specific roof actually receives. Net metering rules and feed-in tariff rates vary significantly by country, state, and utility provider; we won't go into those details here, but they are worth researching alongside your roof's solar potential before making any decisions.
This guide focuses on the one factor you can evaluate yourself before speaking to any installer: the physical solar potential of your home. That means understanding your roof's orientation and tilt, how shading from trees, chimneys, and neighboring buildings affects output across all seasons, and how to use 3D sun simulation tools to build a clear picture of your roof's real-world performance — not a regional estimate.
We'll walk you through the key factors that determine solar viability, how to run your own shadow analysis, what irradiance numbers actually mean, when a house is not a good solar candidate, and how to use your own data when talking to installers. By the end, you'll be able to answer the question 'is my house good for solar?' with actual evidence.
How to Evaluate Your House for Solar:
Why This Question Matters Before You Spend Anything
Not All Roofs Are Created Equal
Beyond the Roof: Facades and Vertical Surfaces
How Shading Destroys Solar Output (More Than You Think)
How to Run a Solar Panel Shading Analysis Before Buying
Understanding Solar Irradiance: The Number That Predicts Your Output
Seasonal Shadow Shifts: Why Summer Results Can Mislead You
When a House Is NOT Good for Solar
How to Talk to Installers Using Your Own Data
FAQs
Final Thoughts
Why This Question Matters Before You Spend Anything
A residential solar panel installation in 2026 costs anywhere from $15,000 to $30,000 in the US, and equivalent sums in European markets — often before local incentives are applied. That is not a small bet. And yet, most homeowners make the decision to invest in solar energy independence based on a single site visit from a salesperson who has every reason to say yes.
The answer to 'is my house good for solar?' depends on a number of questions usually asked by solar solution providers. First, what are your goals? Are you looking to reduce energy bills, increase energy independence during power outages, improve the value of your home, or all of the above? There are many factors to consider that vary by season, time of day, and the exact geometry of your roof and surroundings. A roof that looks sun-drenched in July can be heavily shaded from October through March, cutting annual output significantly.
Empower your solar energy investment decision-making with your own analysis. This guide walks you through how to evaluate your roof's solar potential yourself, using sun simulation tools, before you consult with a solution provider.
Not All Roofs Are Created Equal
Several physical factors determine whether your home will produce enough energy to make solar worth the investment, including the quality and position of your roof.
Roof Orientation and Tilt
In the Northern Hemisphere, south-facing roofs receive the most direct sunlight throughout the year. A roof pitched between 15 and 40 degrees typically captures solar energy most efficiently, though the ideal angle depends on your latitude. East and west-facing roofs can still work well, especially if you use time-of-use electricity pricing. North-facing roofs are generally not viable as the primary panel location.
Roof Condition and Available Space
Panels last 25 to 30 years. If your roof needs replacement within the next 10 years, you will likely need to remove and reinstall the panels, adding significant cost. Installers will flag this, but it is worth knowing before the conversation starts.
You also need enough unobstructed surface area. A roof covered in skylights, vents, and dormers leaves little room for a useful array.
Your Local Climate and Sun Hours
Peak sun hours vary significantly by location. For example, in the US, Phoenix, Arizona averages around 6.5 peak sun hours per day, while Seattle, Washington averages closer to 3.5. This directly affects how much power your panels generate annually.
Even in cloudier climates, solar can still make financial sense, but your payback period will be longer. The key is knowing your specific numbers, not national averages.
Beyond the Roof: Facades and Vertical Surfaces
Roofs are generally the first surfaces considered for solar panel placement — but they are not the only option. Vertical building facades with the right orientation can also generate meaningful solar output, and in some cases offer advantages that a roof cannot.
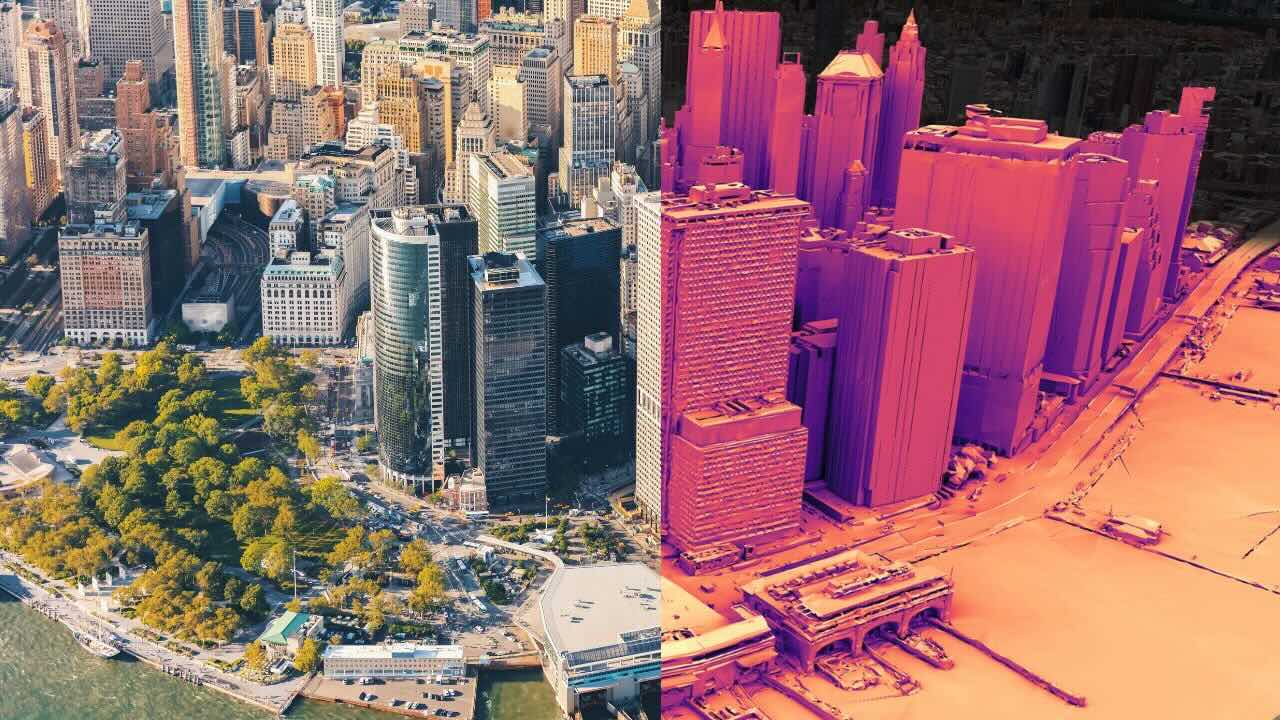
This is where most 2D solar planning tools fall short. Analyzing a facade's solar potential requires understanding how shadows from the building itself, neighboring structures, and terrain interact with a vertical surface across different times of day and year. That analysis only works properly in three dimensions.
Shadowmap's 3D simulation environment lets you evaluate facade surfaces alongside roof surfaces — visualizing how sunlight and shadows move across the full building envelope at any date and time. This is especially relevant for Building-Integrated Photovoltaics (BIPV), where solar elements are incorporated directly into the building fabric rather than mounted on top of it. For a deeper look at why 3D shadow planning is essential for facade solar, see our dedicated article: BIPV Starts with the Sun: Why Building Orientation and 3D Shadows Decide Success.
How Shading Destroys Solar Output (More Than You Think)
Shading is the single biggest variable that installers underestimate and homeowners overlook. Even partial shading on one panel can reduce output across an entire string of panels by 20-50%, depending on how the system is wired. Modern microinverters and DC optimizers reduce this effect, but they do not eliminate it. A panel that is shaded for four hours a day is simply not producing output during those hours.
The Problem With Trees
A tree that sits 20 feet from your roofline might cast almost no shadow in summer when the sun is high. That same tree, in December, when the sun angle drops to 25 degrees above the horizon, can shade your entire south-facing roof from 9 AM to 3 PM.
Deciduous trees lose their leaves in winter, which helps. But evergreen trees, pine trees, and large oaks can create year-round shading problems that are invisible during a summer site visit by the installer.
Chimneys, Vents, and Dormers
A chimney on the south side of your roof creates a moving shadow that sweeps across your panels throughout the day. In winter, when the sun stays low, that shadow can cover a large portion of your array for most of the day.
Roof vents can cause similar issues. These are small obstructions, but their shadow impact scales with sun angle.
Neighboring Buildings
This is the most overlooked factor in urban and suburban settings. A two-story house to your south can block morning or afternoon sun, especially in winter. An apartment building or commercial structure can shade your roof for hours every day.
If your neighborhood is changing, a vacant lot next door could become a three-story building within five years. That is worth thinking about before a 25-year investment.
How to Run a Solar Panel Shading Analysis Before Buying
You can run a detailed shadow analysis yourself using browser-based tools before making any commitments.
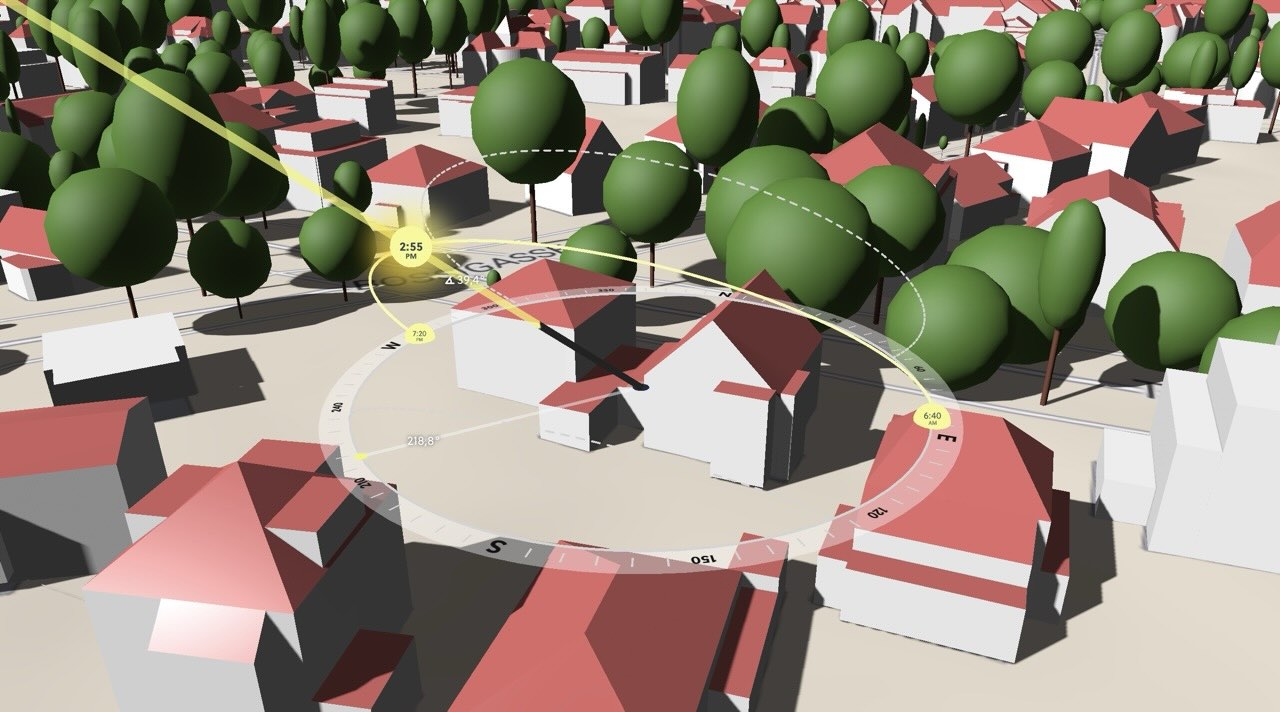
Using Shadowmap to Simulate Sun and Shadows
Shadowmap lets you pick any location on Earth, set a specific date and time, and see exactly how sunlight and shadows fall across buildings, terrain, and custom 3D models. You do not need to install anything. It runs entirely in your browser.
Here is how to use Shadowmap for a solar evaluation:
Search your address. Shadowmap renders your location in 3D, including surrounding buildings and terrain.
Set the date to December 21 (winter solstice). This is when the sun sits lowest in the sky and shadows are longest. If your roof looks good on this date, it will look good year-round.
Scrub through the hours from sunrise to sunset. Watch where shadows from trees, chimneys, and neighboring buildings fall on your roof area.
Repeat for March and June to understand how shading changes seasonally.
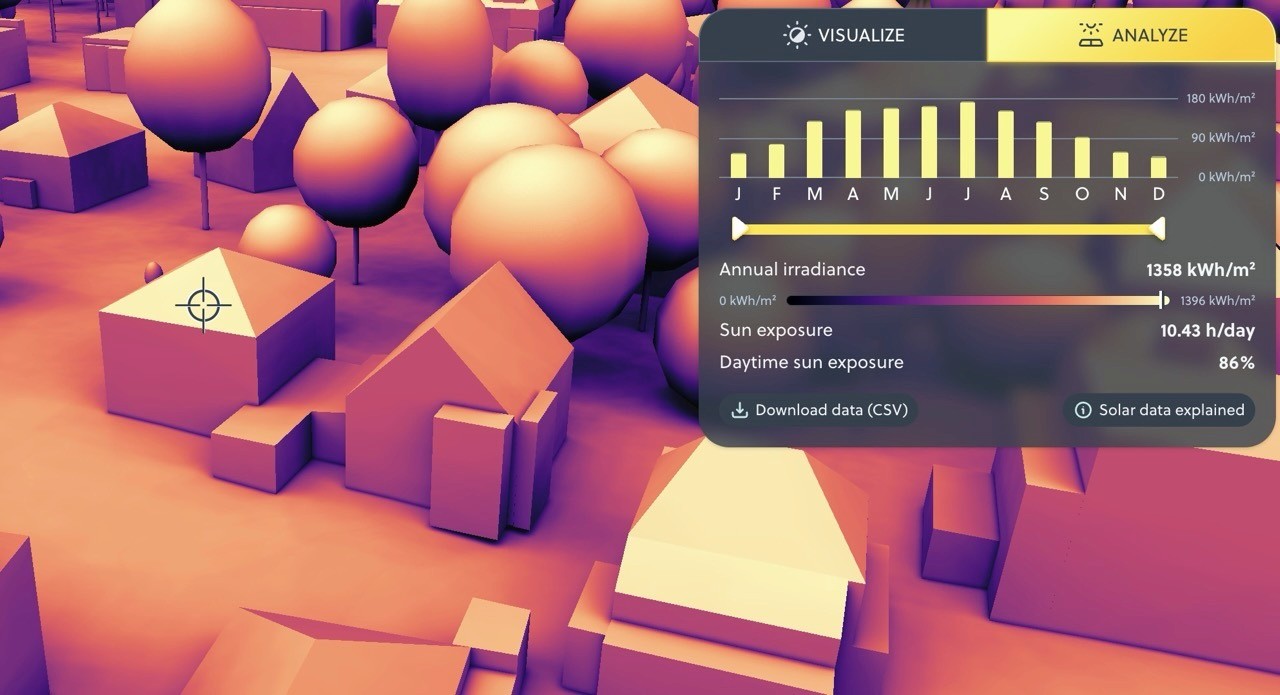
Use the Solar Analytics feature to see cumulative sun exposure across your roof surface. This shows you which parts of your roof receive the most energy, which directly maps to where panels should go.
This process takes about 20 minutes and gives you more useful data than most homeowners have when they sit down with an installer.
What to Look For in Your Analysis
You are looking for roof sections that stay unshaded for at least 4 to 6 hours during peak sun hours (roughly 9 AM to 3 PM) across all seasons. The table below summarises what each scenario means:
Scenario | Verdict | What it means |
|---|---|---|
Unshaded 9 AM – 3 PM all seasons | ✅ Excellent | Prime panel location — prioritise this section |
Shaded before 10 AM, clear 10 AM – 4 PM | 🟡 Good | Still viable; morning shading has limited impact on daily total |
Shaded 10 AM – 2 PM in December | 🔴 Problem | Peak-hour winter shading — significant annual output loss |
Shaded for more than 4 peak hours in winter | 🔴 Not viable | Avoid placing panels here; explore other roof sections or facades |
Pay attention to the irradiance values across different roof sections. A section with consistently high irradiance values is where your panels will perform best.
Documenting Your Findings to Discuss with Your Solar Provider
Take screenshots from your Shadowmap analysis showing shadow coverage at the winter solstice and the irradiance map across your roof. These become the basis for a productive installer conversation — see the section on talking to installers below.
Understanding Solar Irradiance: The Number That Predicts Your Output
Solar irradiance is the amount of solar power hitting a surface per unit area, measured in watts per square meter (W/m²). It is the core number that determines how much electricity your panels will actually generate.
A solar irradiance calculator does not just tell you whether the sun is shining. It tells you how intensely it is shining at a specific angle, on a specific surface, at a specific time of year. That distinction matters a lot.
Two roofs in the same city can have meaningfully different irradiance values based on tilt, orientation, and surrounding obstructions. Shadowmap's irradiance analysis accounts for all of these variables, giving you a realistic picture of your roof's solar potential rather than a regional average.
When comparing roof sections, look for cumulative annual irradiance. A section receiving 1,600 kWh/m² per year will outperform a section receiving 1,200 kWh/m² by about 33%, even if they are on the same roof.
Seasonal Shadow Shifts: Why Summer Results Can Mislead You
This is one of the most common mistakes homeowners make. They visit a property in June, the roof looks perfect, and they assume it will perform well year-round.
The sun's path changes dramatically between summer and winter. In summer, the sun rises in the northeast, climbs high in the sky, and sets in the northwest. Shadows are short and mostly fall to the north. In winter, the sun rises in the southeast, stays low on the horizon, and sets in the southwest. Shadows are long and can reach far to the north and east.
A tree 30 feet tall that casts a 10-foot shadow in June can cast a 60-foot shadow in December — based on a winter sun angle of roughly 25° above the horizon. That is the difference between a clear roof and a shaded one.
This is exactly why running a shadow analysis across multiple dates, not just one, gives you an accurate picture. Shadowmap lets you move through any date and time of year, so you can see the full seasonal range of shadow behaviour at your specific address.
When a House Is NOT Good for Solar
Some homes genuinely are not good candidates for rooftop solar. Knowing this before you invest time and money in quotes is valuable.
✅ Good solar candidate | 🔴 Poor solar candidate |
|---|---|
South/east/west-facing roof sections available | Only north-facing roof surface |
At least 200 sq ft of unobstructed space | Roof fragmented by skylights, vents, and dormers |
Unshaded for 4+ peak hours in winter | South-facing roof shaded 4+ peak hours in winter |
Roof in good condition, 10+ years remaining | Roof replacement needed within 5 years |
Deciduous trees or manageable shading to the south | Large evergreen trees to the south or southwest |
Open surroundings or low neighboring buildings | Taller neighboring building directly to the south |
If your roof does not work, community solar programs and ground-mounted systems are worth exploring. Some utilities also allow virtual net metering, where you subscribe to a shared solar farm and receive credits on your bill without any roof installation.
How to Talk to Installers Using Your Own Data
Walking into an installer conversation with your own shadow analysis changes the dynamic. You are no longer relying entirely on their assessment.
Bring screenshots from your Shadowmap analysis showing shadow coverage at the winter solstice. Ask the installer to explain how their proposed panel layout accounts for the shading you identified. Ask specifically about the irradiance values they are using in their production estimates and whether those values match your roof's actual orientation and shading profile.
A good installer will welcome this. They will use their own tools to verify your findings and may identify things you missed. An installer who dismisses your data or cannot explain their production estimates clearly is worth being cautious about.
Also ask whether the system design uses string inverters, microinverters, or DC optimizers, and how that choice accounts for any partial shading on your roof. The answer tells you a lot about how seriously they have thought about your specific situation.
FAQs
How do I know if my roof gets enough sun for solar panels?
The standard benchmark is at least 4 hours of direct, unshaded sunlight during peak sun hours (9 AM to 3 PM) per day. Use a solar irradiance calculator or shadow simulation tool like Shadowmap to check your specific roof across different seasons, not just summer.
Does shading really matter that much for solar panels?
Yes. Even partial shading on one panel can reduce output across a string of panels by 20-50%, depending on your inverter setup. Shading from a single tree branch during peak hours has a measurable impact on annual energy production.
What is the best roof orientation for solar panels?
In the Northern Hemisphere, south-facing roofs at a pitch between 15 and 40 degrees typically produce the most energy. East and west-facing roofs can still be viable, especially with time-of-use electricity rates. North-facing roofs are generally not recommended as the primary panel location.
Can I check solar potential without hiring anyone?
Yes. Tools like Shadowmap let you simulate sunlight and shadows at your exact address for any date and time of year, directly in your browser. You can run a full solar panel shading analysis and review irradiance values before speaking to a single installer.
What is solar irradiance and why does it matter?
Solar irradiance measures the intensity of sunlight hitting a surface, expressed in watts per square meter. It determines how much electricity your panels will actually generate. Two roofs in the same city can have different irradiance values based on tilt, orientation, and shading, which is why location-specific analysis matters more than regional averages.
How do seasonal changes affect solar panel performance?
The sun sits much lower in the sky during winter, creating longer shadows. A roof that is clear in summer can be significantly shaded from October through March. Running a shadow analysis at the winter solstice (December 21) gives you the worst-case scenario and is the most reliable test of year-round viability.
Should I remove trees to improve solar performance?
It depends on the tree's location and size. A large evergreen directly to your south that shades your roof from 10 AM to 2 PM in winter will meaningfully reduce your annual output. A deciduous tree that only shades your roof in early morning may not be worth removing. Use a shadow simulation tool to quantify the actual impact before making that decision.
Final Thoughts
The question 'is my house good for solar?' has a real answer, and you can find it before spending anything. Run a shadow analysis at the summer and winter solstice. Check your roof's irradiance across different sections. Look at how shading from trees, chimneys, and neighboring buildings shifts across the year.
Start with Shadowmap, spend 20 minutes on your address, and you will walk into any installer conversation knowing what your roof can actually do. That is a better starting point than any salesperson's estimate — and it costs nothing.
Share this article:

LEARN MORE
Illuminating insights


AS Seen On


