Share:

What Sunscore is
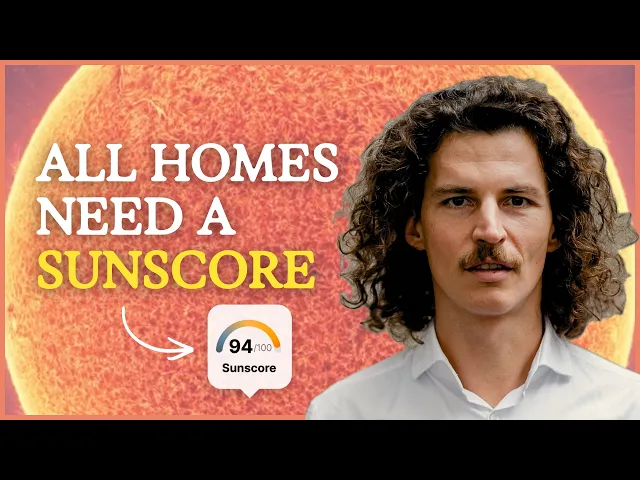
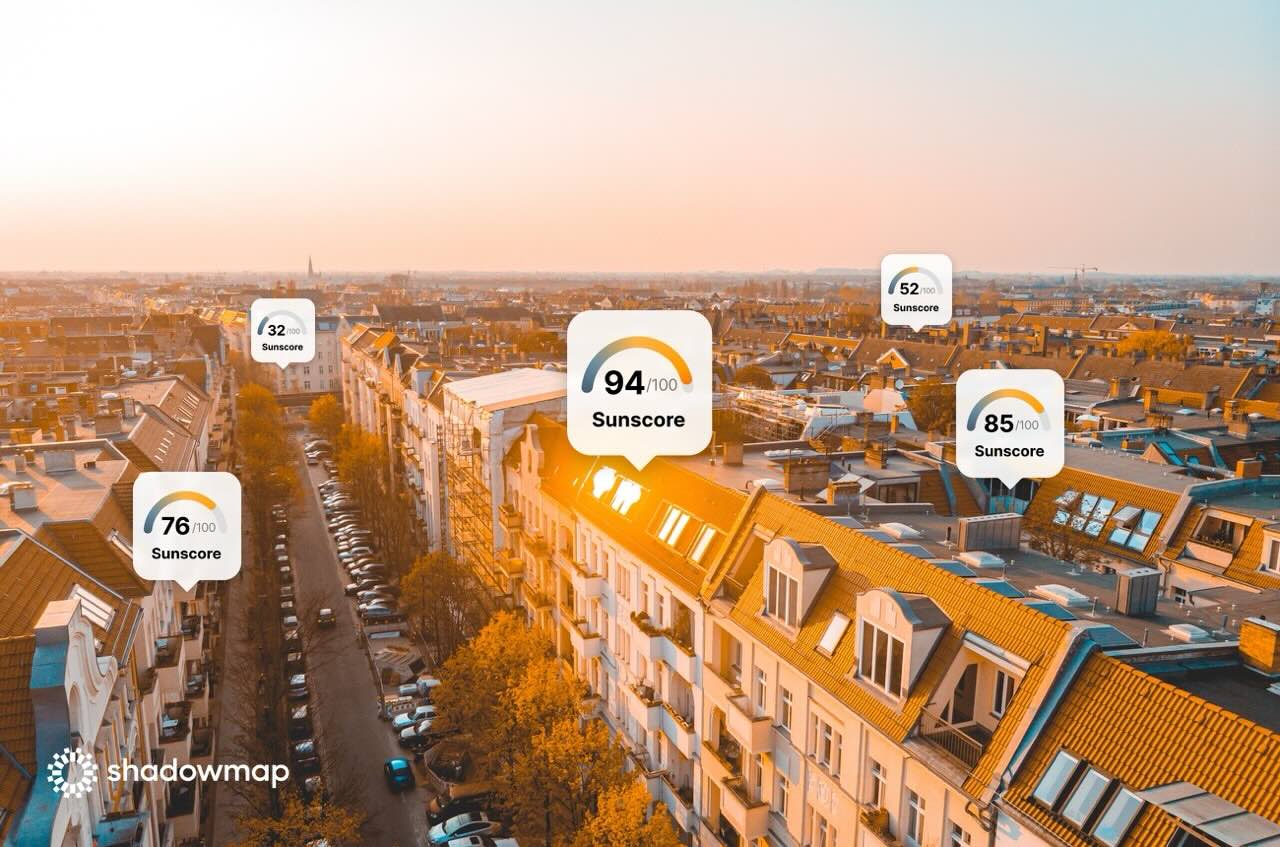
Sunscore is a single number from 0 to 100 that represents how much Sun an object receives across a full year.
100 means the surface is in sunlight at every moment of daylight throughout the year. 0 means it is never in sunlight. Every real building sits somewhere in between.
Although buildings are the first application, Sunscore is not limited to them. In principle, it can be calculated for any object with a surface. Buildings are where we started, not the definition.
What Sunscore is not
Three boundaries are worth stating up front because each is what people most often assume.
It ignores weather – by design. Sunscore accounts for the physical objects that block the sun: neighbouring buildings, trees, mountains, terrain. It does not account for cloud cover, and that is deliberate. Occluders are hard facts and constant. Weather fluctuates and is hard to predict. A cloud may be there or it may not. So Sunscore is a foundational, clear-sky score, and average weather is a candidate feature to layer on top later, not something folded into the base measurement.
It measures external surfaces. Sunscore scores the outside of a property, its facades and roof, not its interior. There is a nuance: some external surfaces are transparent. Windows are external surfaces, so the score does say something by extension about the light reaching inside. Once window positions are known, whether detected from imagery or marked manually, an indoor Sunscore becomes inferable. That is a roadmap item, not part of version one.
Version one is deliberately simpler than what is possible. It is still complex to compute, but it is kept simple from the customer's point of view. That simplicity is a design choice, not a shortfall.
How Sunscore is calculated
The calculation has four steps.
1. Distribute points across the surface. Take the building, or whatever object is being scored, and spread a set of sample points evenly across every facade and roof. The number of points is a tunable trade-off: more points give a more accurate score, fewer points compute faster. A typical building carries thousands of points.
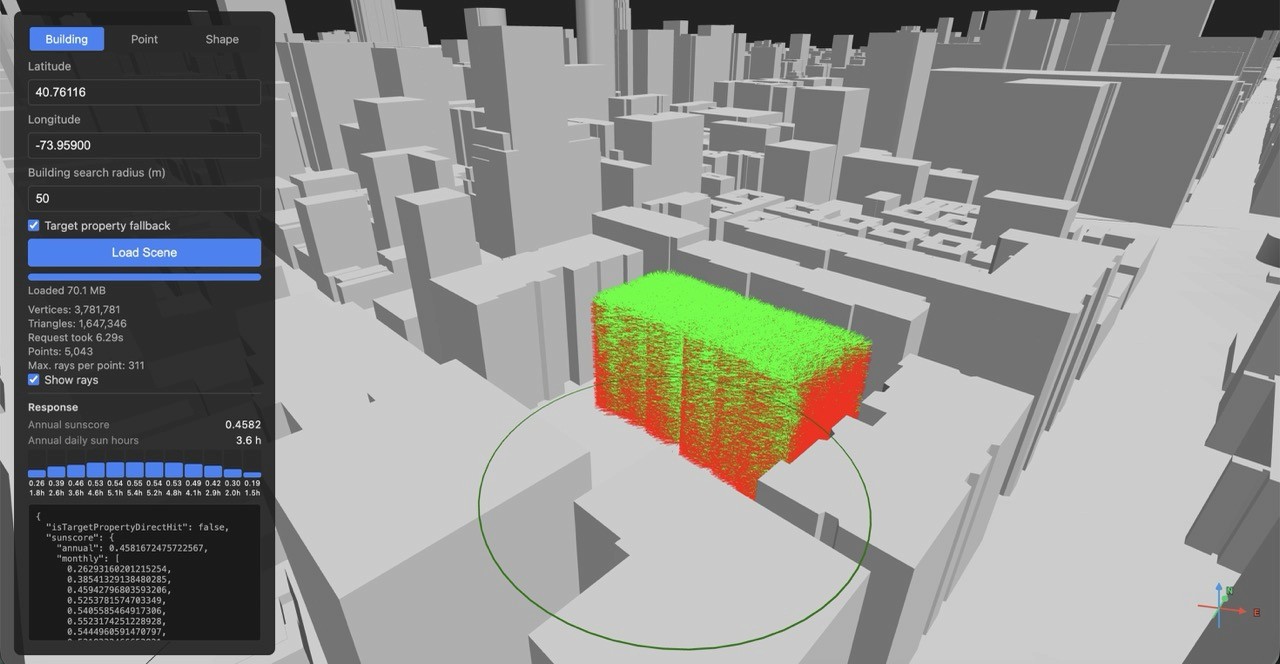
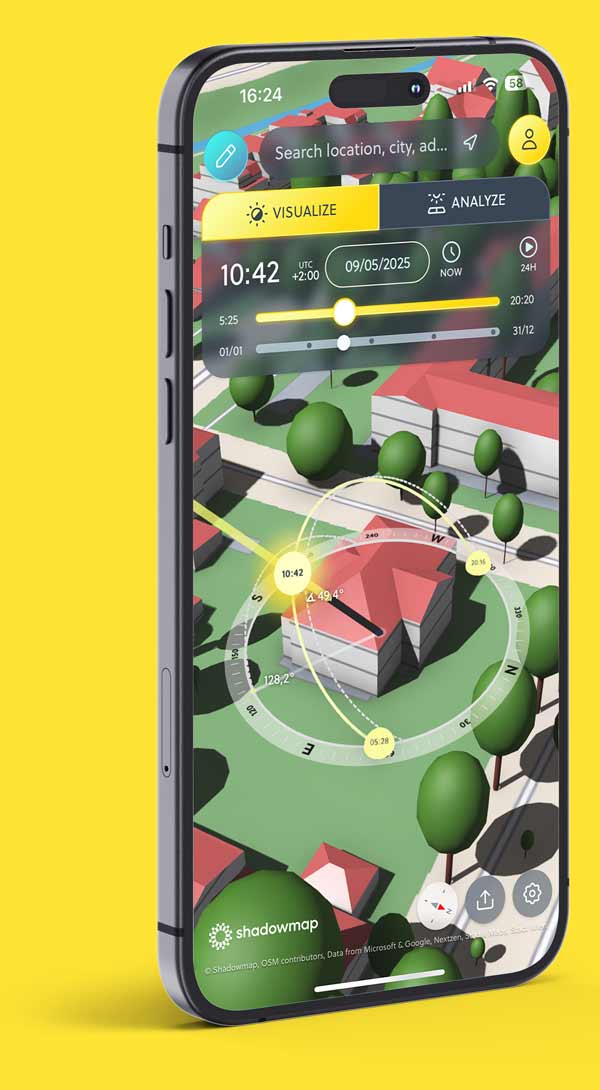
2. Step through the year at each point. For every sample point, walk the Sun's movement across the entire year in small time steps of roughly three minutes. At each step, cast a ray from the Sun's position to the point and test whether it is exposed to the Sun or blocked by an occluder. In Shadowmap's internal visualisation, this is exactly what the coloured lines show: a green ray reaches the point unobstructed, a red ray is blocked.
3. Score each point. A point's score is the fraction of time steps in which it was exposed to the Sun.
4. Average to the object. The property's Sunscore is the average of the scores of all its sample points.
The scale of it
A year divided into three-minute steps is roughly 175,000 samples per point. Multiply by thousands of points per building, and a single Sunscore rests on millions of individual sun-visibility tests. It completes in a few seconds. It’s our secret sauce to optimize these calculations in a way that significantly speeds up the process while still being highly accurate.
One refinement worth naming
Where a building is partly sunk into a slope, some sample points fall below the terrain surface. These are identified and excluded, because they are permanently in shade by definition and would otherwise drag the average down for no informative reason. They do not count.
The two foundations
Everything Shadowmap does rests on two things: three-dimensional data, and the position of the Sun in the sky. Every shadow calculation needs a light source, 3D structures that cast shadows, and 3D structures that receive them.
Sun position is a solved problem, and one that deserves more appreciation than it gets. Established astronomical formulae, published as scientific papers running to tens of pages, take a location on Earth and a moment in time and return the Sun's azimuth and altitude. No API, no service dependency. They hold for tens of thousands of years into the past and future, and they account for effects as subtle as the slow wobble in Earth's axis. It is a large piece of human work that modern software now takes for granted.
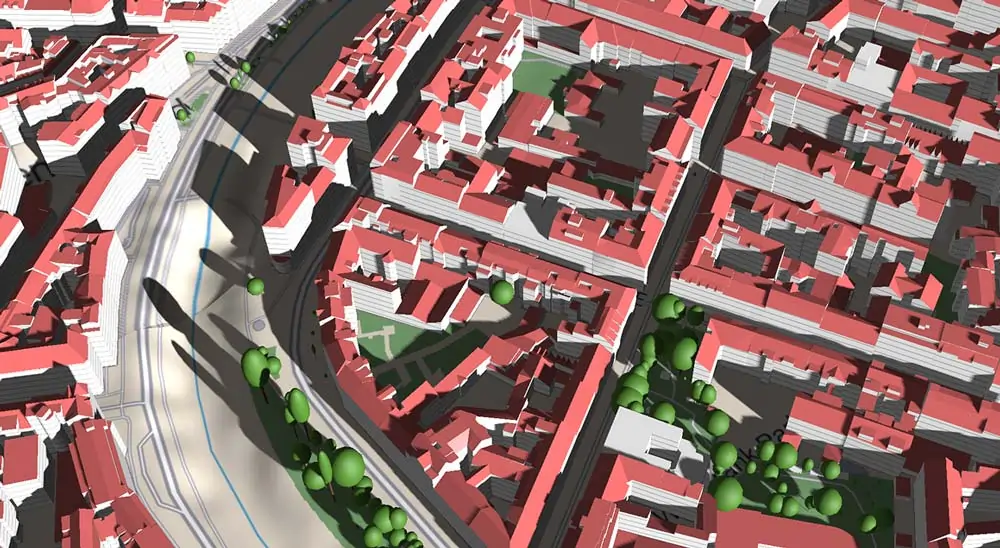
Shadow casting is where Shadowmap differentiates. It renders shadows from any 3D source onto any 3D source. Some other tools impose artificial limits, casting only building-on-building or only terrain-on-terrain, and cannot represent terrain casting onto a building or vice versa. That matters: if a mountain casts a shadow across a property and the tool cannot show it, the user is not merely underinformed; they are misled.
There is a known limit. Occluders beyond a certain distance are not considered, so a very distant mountain will not cast into the model even if it casts in reality. In principle, this is boundable, because Earth's curvature sets a hard maximum on how far even the tallest mountain can throw a shadow before the horizon intervenes. Still, a fully robust version of this is not yet built, but it is on our roadmap.
Where the data comes from
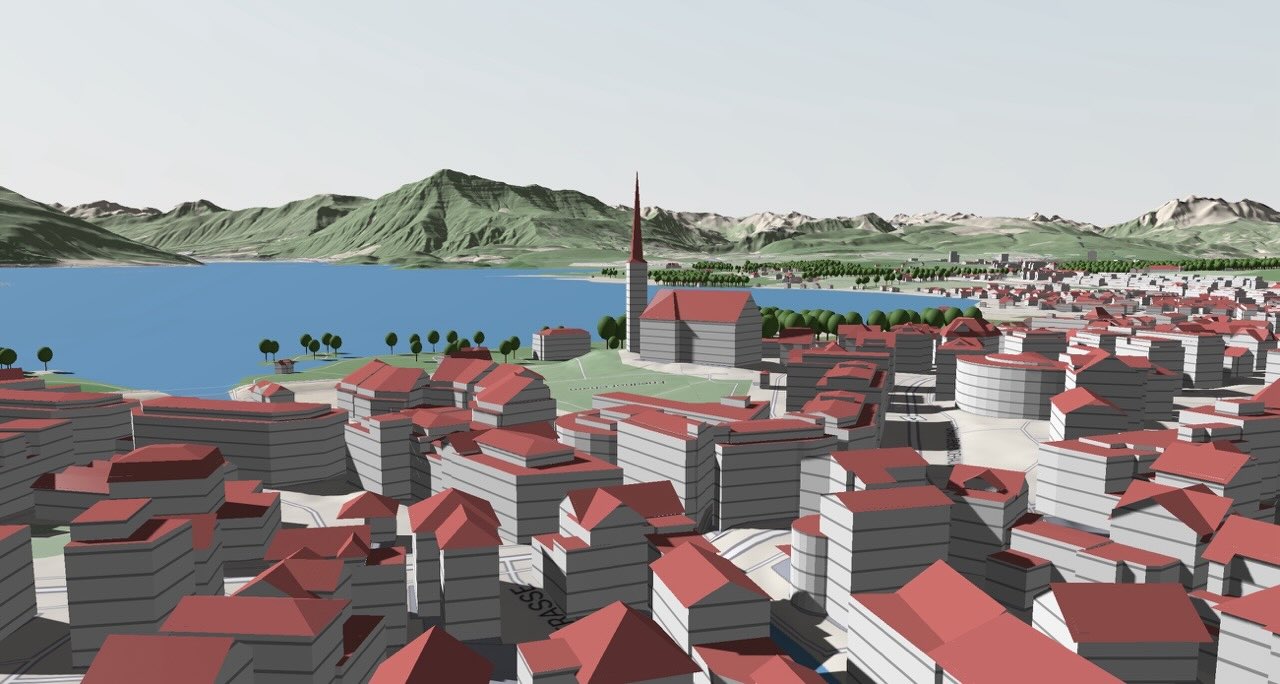
Buildings. The backbone is OpenStreetMap, a crowdsourced global map that is exceptionally well maintained and usually carries very recent data, including new buildings. Its weakness is uneven quality: cities with active contributor communities are mapped beautifully, other places much less so. The Overture building dataset fills those gaps, supplementing OSM with machine-generated buildings drawn from satellite imagery and heights derived from lidar, adding structures no human has mapped yet.
Trees also come from OpenStreetMap.
Terrain comes from sources released by governments and scientific agencies around the world.
Sovereign data. Some municipalities run open-data programmes publishing high-detail, classified 3D building data. Shadowmap currently uses sovereign data in Vienna, Munich, Berlin, Tokyo and Switzerland, with more cities and countries to follow, including the Netherlands which is coming next. This is why fidelity in, e.g., Vienna, including roof geometry, exceeds that available in the UK or the US. There is no sovereign data in the US at present: plenty of LiDAR, but little classified LOD2 data.
A note on OpenStreetMap
It may have been the first digital map in the world, predating Google Maps and other map platforms. It began with ordinary people walking their streets with GPS trackers, logging waypoints, standing on the corners of their own houses and pressing a button, mapping the world point by point before any company did. Shadowmap runs on that data, and runs on it for free, which for a startup is not a small thing. Worth saying so. So thanks go out to all the contributors of OpenStreetMap; apps like Shadowmap wouldn’t be possible without your help!
Why not Google 3D
Google's 3D data is more detailed than a simple block model and would, in principle, yield a more precise Sunscore. Two things prevent using it. First, classification: Google 3D is a continuous mesh of triangles with no object boundaries, so the tree blends into the ground, the ground into the wall, the wall into the next building. You cannot point at "this building" because there is no "this building" in the data. OpenStreetMap, by contrast, defines a building as an entity with an ID, so building 72 can be named and meant. While segmentation is solvable with AI classification, Google’s terms do not allow this at the moment. However, 3D data coverage and quality are set to improve across the world, and this will greatly benefit Shadowmap and all its related products.
Where the data is heading
The picture is improving fast: sharper satellites, better 2D-to-3D reconstruction, and phone-based 3D scanning that now produces high-quality meshes without dedicated hardware. Walk around a house with a phone, and you capture the window openings, the roof planes, and a clear view of where solar panels go and where light enters. A few years out, the data problem may be essentially solved.

The confidence score
Sunscore ships with a confidence score from 0 to 1, where 1 is maximum confidence.
In practice, it currently rests on a single metric: the proportion of buildings in the calculation that carry a real height value in metres. Many buildings on the map have only a footprint and no height, so where height is missing, it must be estimated; where a building declares its height, that is taken as true. The percentage of contributing buildings with a genuine height attribute becomes the confidence figure.
This is a first pass, and it will be further improved. Sovereign data, with its high-detail geometry, warrants higher confidence than an OSM footprint with only a height tag – upcoming versions of Sunscore will also support LOD2 sovereign data.
Current Sunscore shortcomings
This is a valuable part of the picture, because these are the problems that come from having Sunscore live in the real world, and being ahead means being the ones who have hit them first.
Finding the right building. A property platform gives us a latitude and longitude, and that point can sit anywhere on the plot, sometimes not on the building at all: in the garden, on a driveway, at an entrance. By default, Sunscore therefore searches within a 50-meter radius for the nearest building, which gives the best chance of finding the right one. It also creates failure modes. If there is no building at the given location, the search finds the nearest one that exists, which may be a neighbour, and produces a perfectly valid score for entirely the wrong property. If a plot has a main house and a smaller outbuilding, and the outbuilding is closer to the coordinate, the outbuilding gets scored. And where no building is found within the radius, a fallback structure is generated. A quick diagnostic: open Sun Profile – the 3D Shadowmap visualization we’re known for – which defaults to the same location; if the ray does not land on the building, you are looking at a fallback.
The address problem underneath. There is no universal mapping from a street address to a main building. What a geolocation service returns for an address – the front door, the entrance from the road, the plot centroid, or the building itself – varies by country and provider. Google Maps stamps the house directly for an Austrian address; a UK postcode is not house-specific, though the UK does have UPRN as a unique property identifier. It works in most cases. It does not work in all of them, and no mechanism guarantees it.
One building, many experiences. A large apartment complex is typically classified as a single building and gets one Sunscore, yet a high south-facing flat and a ground-floor north-facing flat share nothing but that number. The current mitigation is to pair Sunscore with the Sun Profiler visualisation, so a resident who knows their floor and orientation can interrogate the model and approximate their own situation. The real fix is better data: floor level, main orientation, and window openings, which some platforms already hold, while others are not permitted to share.
Sunscore is a snapshot. Whenever new underlying data arrives, Sunscore must be recalculated. A Sunscore is always as of a given state of the data, and that needs to be said plainly to anyone integrating it.
The strategic point
The algorithm itself is not exotic. As our developer Vlad put it, nothing in it was especially hard, and the reason nobody built this before is not that it was too difficult to build, but that it was too difficult to sell, because people did not yet see a use for it.
The real difficulty, and the real moat, is everything around the algorithm: e.g., overall context awareness, accurate 3D data, addresses, fallbacks, classification, apartment-level data. Shadowmap is ahead because it has hit those problems and is committed to solving them, and staying ahead means keeping a development roadmap behind that work. The corollary is that Sunscore needs to be in as many places as possible, as fast as possible, so that it becomes the default standard. We are convinced that just as digital 2D floor plans were an innovation 25 years ago and are now considered a standard, Sunscored buildings and apartments will be a standard in a few years from now.
Share this article:
LEARN MORE
Illuminating insights


AS Seen On